CREATE @ Boekmanstichting
On Monday May 18 CREATE researcher Claartje Rasterhoff will present her research at the Boekmanstichting and emphasize the need for a historical perspective in discussions on creative industries (in Dutch). More info and registration: here. READ MORE
Cfp: Historical Network Research 2015 International Conference
Historical Network Research (http://historicalnetworkresearch.org) Historical Network Research 2015 International Conference Call for papers The Historical Network Research is pleased to announce its 3rd Annual conference. Having been held in Hamburg in 2013 and Ghent in 2014, this year it will be held in Lisbon, onREAD MORE
Workshop: Tool Criticism for Digital Humanities
Interesting workshop on tool criticism for digital humanities on May 22nd, co-organized Centrum Wiskunde & Informatica, the eHumanities group of KNAW and the Amsterdam Data Science Center. More information and registration here.READ MORE
How to: get your data into R
By Ivan Kisjes R is a free, open source, flexible and data analysis package. It has powerful visualisation tools and is very versatile and customizable. You can use R for serious analysis of any data set, and because the way you work in R is programmatic, your results areREAD MORE
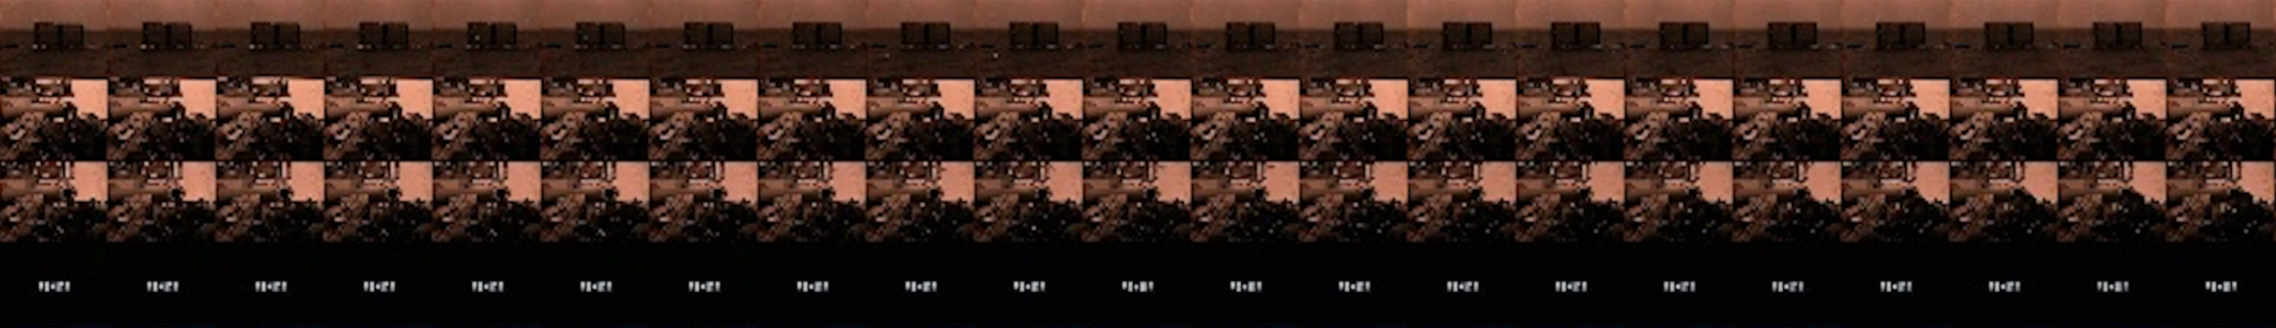
CREATE Salon # 6: Performing Arts Data Part II: Cinema & Theatre
In the sixth CREATE Salon we followed up on the topic of Performing Arts data. This time, we invited speakers to reflect on using datasets for analysis of, for instance, patterns of spatial distribution and network formation in cinema and theatre. Two datasets took centerREAD MORE
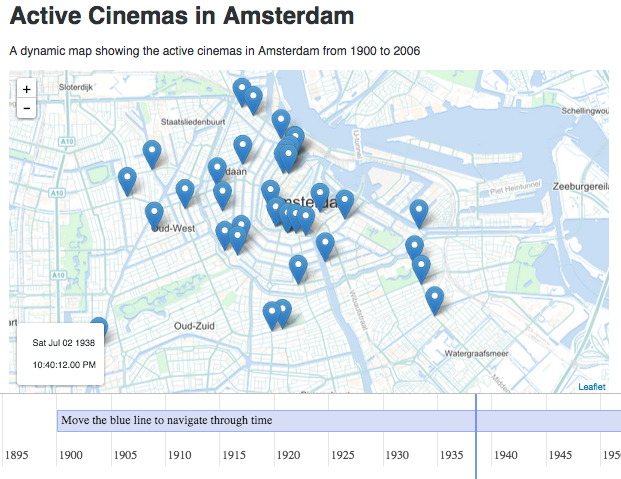
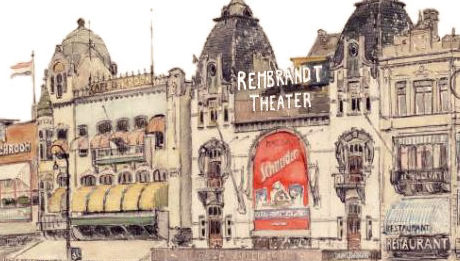
How to: make a dynamic map of Amsterdam
An animated and layered map showing some changes through time is a powerful tool when it comes to visualisation. It´s a great way of visualising the interaction of the actors in the creative industry for a given period of time. Let´s take as example thisREAD MORE
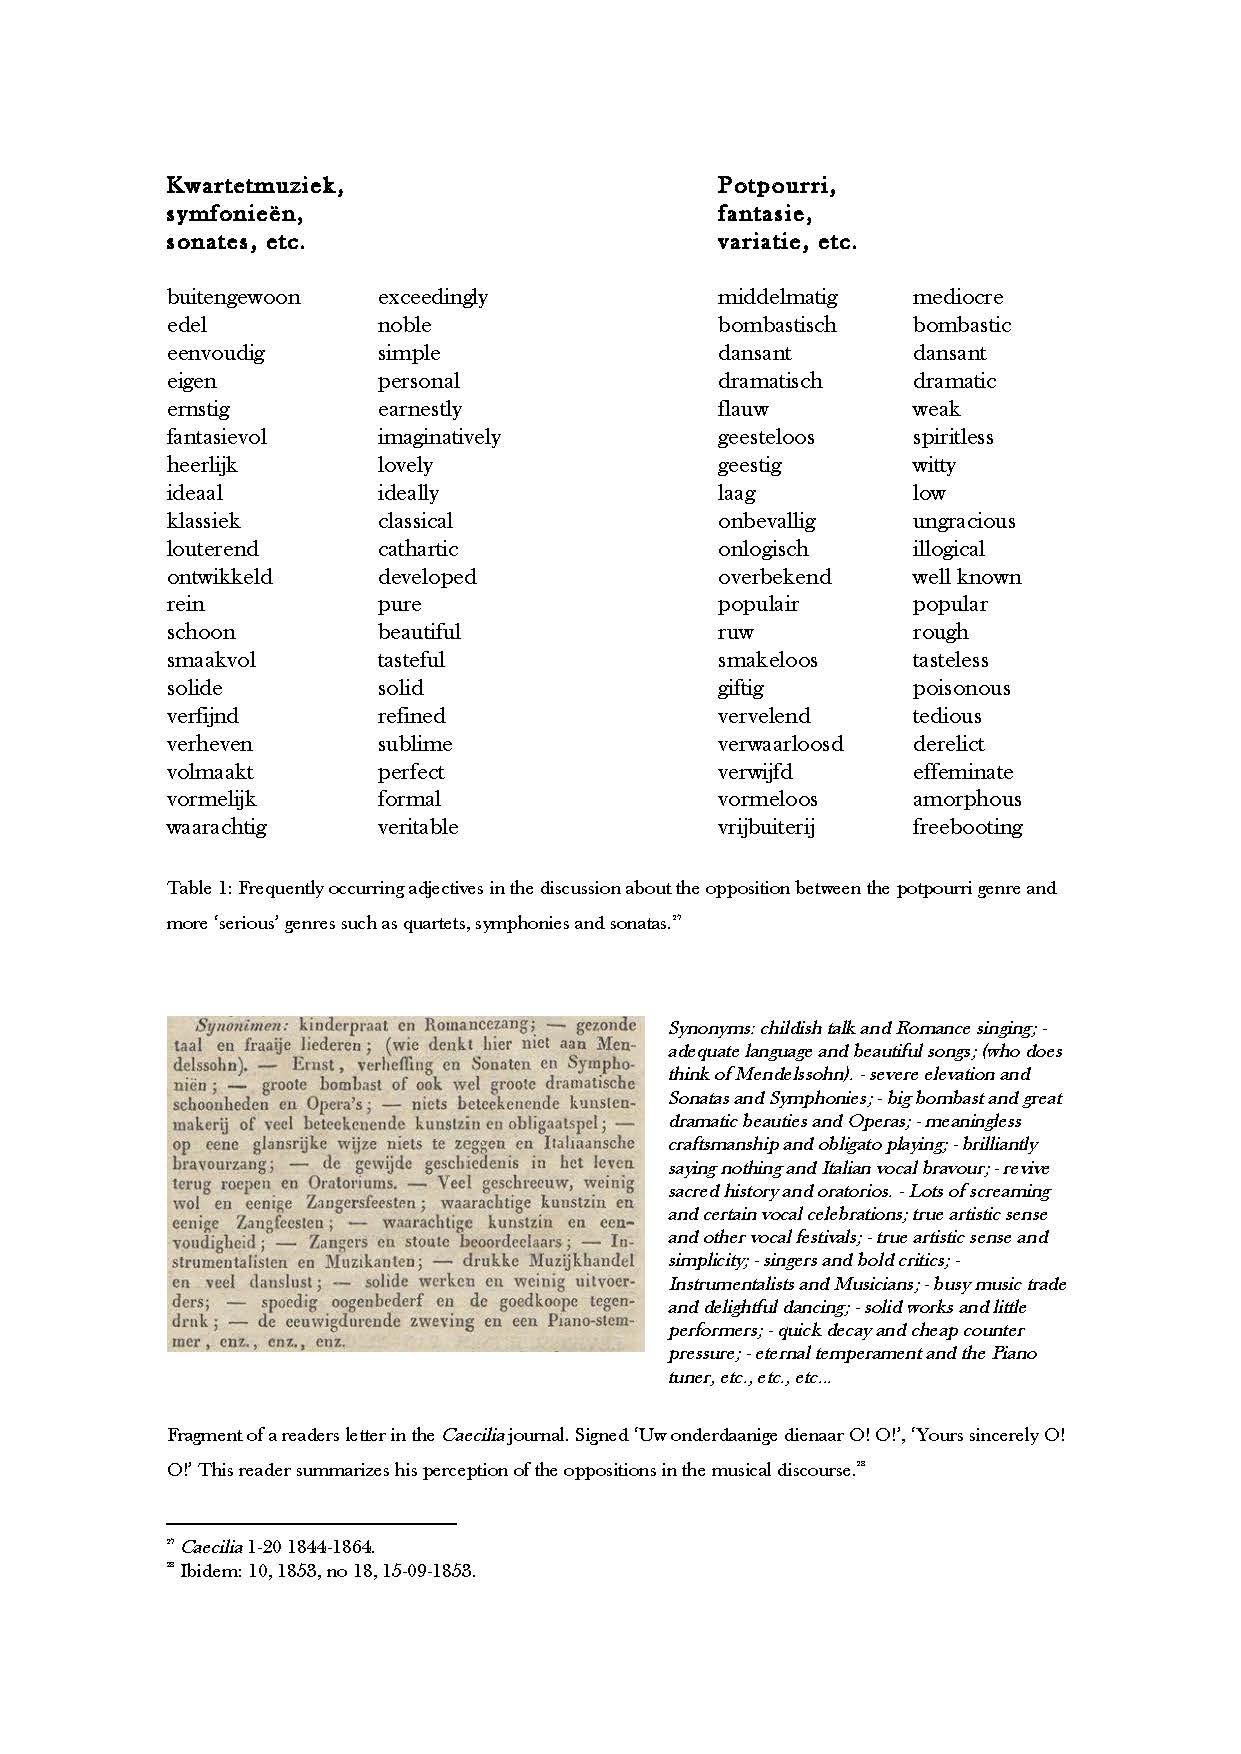
Musical idealism: Dutch perceptions of the potpourri genre
By Mascha van Nieuwkerk Within my CREATE project on Felix Meritis Programmes, research questions and the development of tools and data collections are in constant interaction. For a collection of cultural musicological essays on authenticity, developed in the UvA Master course Cultural Musicology, I investigatedREAD MORE
Workshop 13 April: Leren werken met een nieuwe zoektool voor de Short-Title Catalogue Netherlands (STCN)
De Short-Title Catalogue Netherlands bevat beschrijvingen van alle bewaard gebleven boeken die vóór 1800 in Nederland of in het Nederlands (met uitzondering van Vlaanderen) gedrukt zijn. Daarmee biedt deze bibliografie een schat aan gegevens voor het onderzoek naar cultuur en maatschappij in de vroegmoderne tijd. AfgelopenREAD MORE
Cfp: “Historical Network Research”
Call for organized session(s) on “Historical Network Research”at Sunbelt XXXV in Brighton UK, 23 June 2015 – 28 June 2015 Social Network Analysis (SNA) is making its way in historical research. Over the last decades a substantial number of studies has shown that both theories andREAD MORE
Next CREATE Salon: 7 April
What? Performing Arts Data Part II: Cinema & Theatre. How to improve functionality of datasets and interfaces for research on the performing arts? When? Tuesday April 7, 3-5 PM Where? Oudemanhuispoort A0.08 Who? Cinema: Kathleen Lotze (UU & UvA), Julia Noordegraaf (UvA), Thunnis van Oort (Universiteit Antwerpen); Theatre:READ MORE